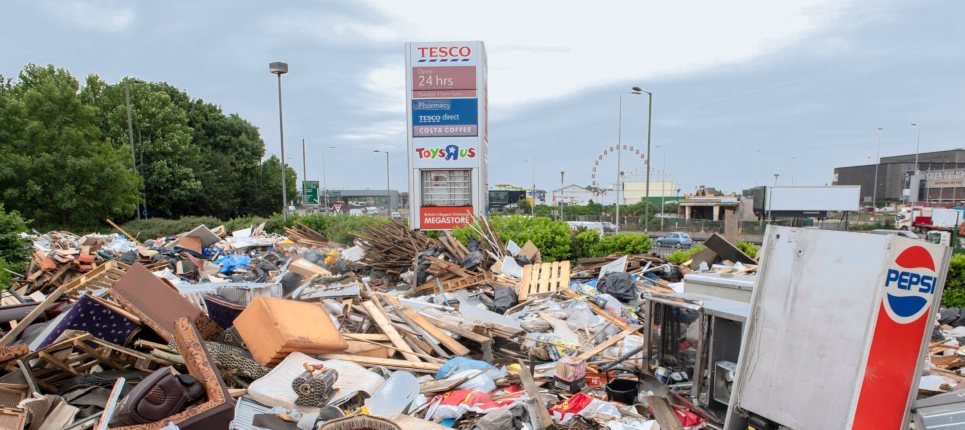
Filthy rich? London fly-tipping
Our research into fly-tipping across London gives new meaning to the term ‘filthy rich’, with Kensington and Chelsea the capital’s most prolific illegal dumping ground, with the equivalent of one in four discarding their waste illegally in the 12-month period from 1 April 2009 to 31 March 2010. [1]
In a bid to understand the extent of fly-tipping and put the problem into some kind of context, we gathered figures reporting the total number of fly-tipping incidents from councils across the capital and cross-referenced them with the population figures of each borough – and the results are pretty alarming.
From April 2009 to March 2010, there were 47,672 incidents of fly-tipping recorded in Kensington and Chelsea, the equivalent of 130 per day. This comes against a backdrop of high skip permit costs: in the same period, the council had the second highest skip permit costs of any borough, charging residents £72 per day for a skip permit, plus £27 per day for a parking suspension bay. Kensington and Chelsea’s unlikely crowning as the fly-tipping capital of London will come as a surprise to many, as the borough is one of London’s most affluent areas and home to half of the streets recently named amongst England and Wales’s 20 most expensive residential addresses. [2]
The borough of Haringey has the second highest rate of fly-tipping in London, with the equivalent of one in seven illegally dumping their rubbish – equating to 85 fly-tipping episodes per day. Hammersmith and Fulham, Kensington and Chelsea’s well-heeled neighbours, and Lewisham complete the top three dumping boroughs, with a rate of one in 17 fly-tipping in both areas.
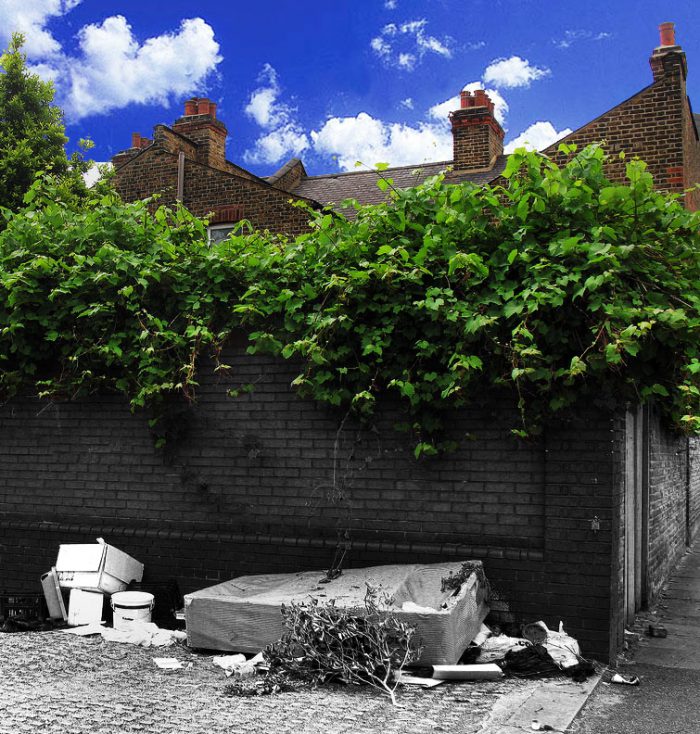
Given the big push to be greener, it’s frustrating that some people still think they’re living in Victorian London and it’s acceptable to dump their waste in the streets or parks or allow dodgy companies to do it on their behalf.
Whilst we realise individuals are often not the ones doing the actual fly-tipping, that doesn’t mean to say they’re entirely blameless. All too often, businesses and homeowners arrange waste to be taken away, but they fail to check whether the company that comes to collect it is registered to do so – either because they don’t realise they have to or simply because they don’t care.
This isn’t helped by the fact that some councils are effectively pricing people out of proper disposal routes with high skip permit prices and associated add-ons like parking suspension bay fees. Indeed, there seems to be a vicious circle around fly-tipping in the capital. The high costs we have highlighted encourage people to look at unscrupulous ways of getting rid of their waste – ignoring legitimate means such as using professional, registered waste carriers. The poor enforcement of fines by many councils only adds to the problem, with the number of actual prosecutions for illegal dumping being extremely low. As a result, more cases of fly-tipping occur and so it continues.
Indeed, taking Kensington and Chelsea as an example, official figures show that there were only two successful prosecutions in the 2008/9 financial year, despite there being 80,548 incidents of illegal dumping recorded and 4,657 legal cases taken against the perpetrators. With such a low prospect of being penalised for their actions, unfortunately, it’s easy to see why many people are taking the easy way out and indiscriminately dumping their rubbish.
Whilst most of London’s boroughs saw a drop in the number of fly-tipping occurrences in the last 12 months, the number of incidents and the rates per head of the population remains extremely high. The table below highlights the top 10 London boroughs with the highest occurrences of fly-tipping per head of the population.
| Rank | London Borough | No. of fly-tips (Apr ’09 – Mar ’10) | No. of people who fly-tip (Apr ’09 – Mar ’10) |
| 1 | Kensington & Chelsea | 47,672 | 1 in 4 |
| 2 | Haringey | 31,173 | 1 in 7 |
| =3 | Lewisham | 15,360 | 1 in 17 |
| =3 | Hammersmith & Fulham | 9,860 | 1 in 17 |
| =5 | Southwark | 12,565 | 1 in 23 |
| =5 | Camden | 9,900 | 1 in 23 |
| 7 | Tower Hamlets | 9,293 | 1 in 25 |
| 8 | Waltham Forest | 8,370 | 1 in 27 |
| 9 | Greenwich | 7,175 | 1 in 32 |
| 10 | Hackney | 6,146 | 1 in 35 |
You can read the official headline statistics and download the full set of results from the DEFRA website.
1 Research based on available data. Eight of the 32 boroughs were unable to respond to AnyJunk’s request for figures, mostly due to incomplete records.
2 Research by Halifax published in December 2009 highlighted the 20 most expensive residential streets in England and Wales, based on sales between 2005 and 2009. Half of those listed were in Kensington and Chelsea.
Image Sources: Alan Stanton & London Evening Standard