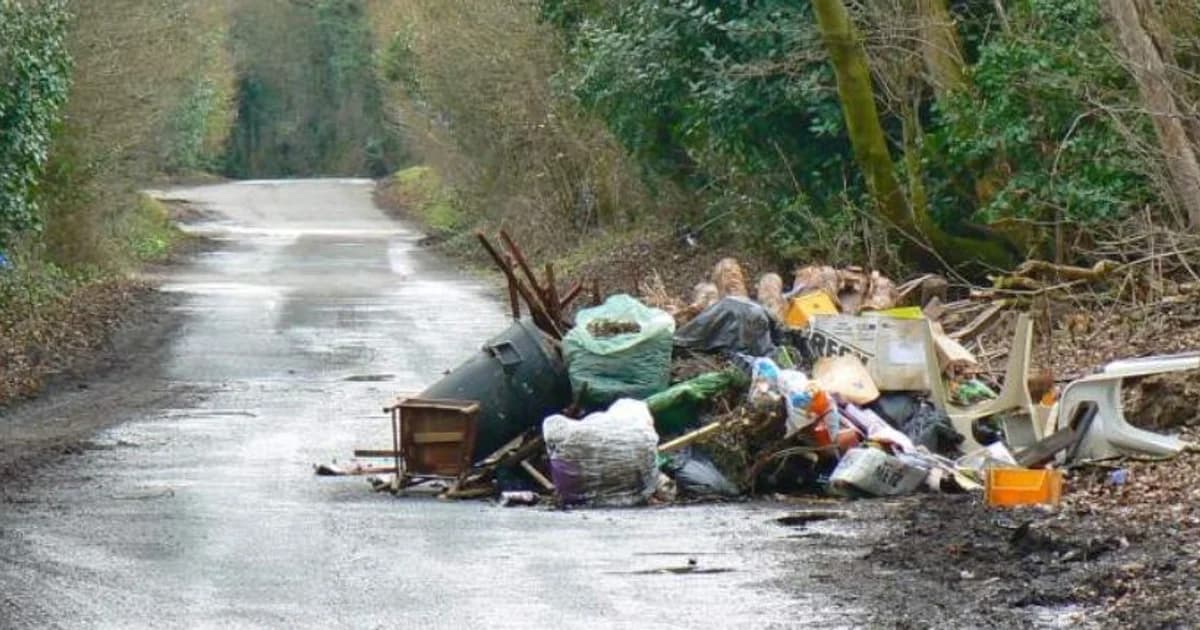
AnyJunk Fly Tipping Report 2012

11 April 2012
The AnyJunk Fly Tipping Report 2012 for the twelve months ended 31 March 2012 is out today and the latest stats show fly-tipping on public land in England in fell almost 10% compared to the prior year (60% of councils fell, 2% were unchanged, and 38% increased). The total annual cost of fly-tipping in England is estimated at £100 million. Our analysis also showed that only 0.6% of fly-tipping incidents resulted in a successful prosecution.
[

](https://www.anyjunk.co.uk/fly-tipping)
The AnyJunk Fly-tipping Report 2012 contains data for the 2011/2012 period which was provided to AnyJunk by councils under the Freedom of Information Act. We compare the figures with Defra fly-tipping statistics for 2010/2011.
Below are a couple of interesting tables from our analysis.
Highest incidents of fly-tipping per capita
| Council | 2011-12 Fly Tips | YoY Change | 1 in X of Pop. Fly Tip |
|---|---|---|---|
| London Borough of Newham | 40,449 | +12% | 6 |
| Sheffield Council | 50,041 | -14% | 11 |
| London Borough of Hounslow | 17,059 | +30% | 14 |
| Great Yarmouth Council | 6,759 | -5% | 14 |
| Newcastle-upon-Tyne Council | 19,281 | -14% | 15 |
| London Borough of Enfield | 19,486 | +287% | 15 |
| London Borough of Lewisham | 15,757 | -59% | 17 |
| London Borough of Southwark | 16,823 | +84% | 17 |
| Sunderland City Council | 15,751 | +133% | 18 |
| Burnley Borough Council | 4,401 | +4% | 19 |
The biggest increase in fly-tipping incidents
| Council | 2010-11 Fly Tips | 2011-12 Fly Tips | Increase |
|---|---|---|---|
| Dudley Metropolitan Borough | 817 | 4830 | 491% |
| Colchester Borough Council | 247 | 1,057 | 328% |
| London Borough of Enfield | 5,030 | 19,486 | 287% |
| Boston Borough Council | 311 | 985 | 217% |
| Warrington Council | 284 | 760 | 168% |
| Sunderland City Council | 6,774 | 15,751 | 133% |
| Huntingdonshire Council | 413 | 907 | 120% |
| Exeter City Council | 431 | 937 | 117% |
| Cheltenham Borough Council | 330 | 708 | 115% |
| South Somerset Council | 919 | 1,790 | 95% |
If you have any comments on our report or suggestions about improving the way in which fly-tipping is dealt with in your area, please do get in touch with us.


